INST362 - SAVVY UX TEAM 12

FINAL REPORT
I.
INTRODUCTION
The University of Maryland has a big campus, which has been around for a long time. Students who live all around, on and off the campus, converge to go to classes during the day. In recent years, new transportation methods have been emerging, such as e-scooters, e-bikes, e-skateboards, ride sharing, and more. The campus, however, has not been able to modify its infrastructure to keep up with these new trends, making walking seemingly still the most popular method to get around campus even with all of these alternatives. Through our research and analysis, we intend to find out students’ current experiences with moving through campus and their preferences to determine an optimal solution for all types of transportation to be utilized efficiently.
III.
AUDIENCES
From our Personas, we sought to interview with people who would frequently traverse around and have a good knowledge of campus. For example, this would include students, on and off-campus, Professors, and faculty/staff members. We created 2 Personas of people who might represent the general audience of using transportation on campus:
I. Victoria Jackson
Role: Student
Demographic:
Year: Sophomore
Full time Information Science Undergraduate Student
Has part-time job as receptionist at Epply, working 3-4 days a week in the evening
Tasks, Needs:
Lives on campus
Uses bicycle to traverse campus
Average 3-5 classes everyday, 5 days a week
Sometimes arrives 5 minutes late to class due to traffic
Has academic and personal responsibilities in and out of school
Outcomes to Achieve:
Find better pathways to ride her bicycle around campus to get to class before it starts or on time
Worry less about running into cars or people when moving between classes
II. Will Adams
Role: Professor
Demographic:
Full time Professor for 10 years in Computer Science Department
Tasks, Needs:
Commutes 45 minutes from home Monday through Friday by car
Has several classes and office hours to teach, and home responsibilities to attend through week
Rides bicycle between classes and buildings on campus
Sometimes arrives a little late to class and takes five to 10 additional minutes to prepare, taking up lecture time
Outcomes to Achieve:
Ability to arrive to class with enough time to prepare
Be able to drive through campus without encountering terrible traffic and during "student rush"
IV.
DISCOVERY RESEARCH
Research Question
"To understand the travelling transportation behaviors and needs of our audience who use the UMD campus."
Participants
Our users of interest in our survey include on-campus students, off-campus students, professors, faculty/staff, and DOTS. On-campus students include those who walk, ride their bicycles, scooters, skateboards, and other innovative transportation methods. Off-campus students include those that commute to campus via cars and metro. DOTS are those who operate or manage the bus system on and to campus. The majority of the audience who were interested in our survey walked around campus. The audience was also indecisive about several questions including whether bikers should be allowed or not on sidewalks. There are professors and faculty/staff who commute to campus via cars and those who are close enough to walk or ride their bicycle.
Of the 52 survey responses, in our first round of interviews, we have successfully interviewed 14 students, all of which are seniors, who walk or bike around campus. We also interviewed one professor who generally walks on campus, but sometimes rides his bicycle as well. We hope to have more participants take our survey and be interviewed so that we can better our understanding on how transportation affects the diverse population on campus and improve the overall experience for all if needed. Our personas overall helped our team understand our target audience because we want to focus on benefiting them, and putting ourselves in their shoes to understand that different people can have different experiences.
Research Methods
We used a google form survey to find out relevant information from our audience (ie. is this their first semester on campus? What mode of transportation did/do they use? Did/do they live on or near campus?). We sent this survey by emailing those from our class lists through ELMS and those that we think are a good fit to gather information from (personal connections). After finding out the relevant information we needed and collected the corresponding data, we then interviewed a group of fellow students and a professor who met certain criteria (have been on campus prior to COVID19, variety of answers, etc.) and had agreed to be further interviewed at times available to them. Our method of interviewing was through Discord and Zoom.
Analyses and Findings
Insights
From interviewing fellow peers and a professor on their experiences of transportation on campus, we were able to find patterns to be analyzed. Through our process of open coding to gather the main points of each interview, and clustering (Axial coding) to group our findings, we have learned much from our data on user needs, suggestions for improvements, and what further research we need to conduct. Much of our data are categorical with asking them to select a choice that best fits the answer to the question, yes and no questions, followed by an explanation to why they chose that answer. Of the 52 survey responses, we learned that 51.9% of our surveyors were seniors, 32.7% were juniors, and the remaining encompassed freshman, sophomores, professors/staff, and DOTS. As it turns out that 4 surveyors are in their first semester at UMD (7.7%), they did not need to continue the survey as they did not have enough experience with moving around campus to give an accurate and long-term response. In learning about our surveyors’ primary mode of transportation around campus, 29 (60.4%) walk, 6 (12.5%) take the bus, 6 (12.5%) drive cars, and 2 (4.2%) ride a bike. When we asked about adding more bike lanes, 89.6% said there should be more bike lanes to lessen congestion of traffic and increase safety, and 10.4% said they are not needed, costly, and take up too much space.
One common and interesting insight that we learned about implementing traffic lights is that pedestrians preferred to not have them installed as it might slow or prevent them from getting to class faster, but car users preferred to have traffic lights as it would help mediate flow of pedestrians crossing the roads. Another major insight we learned is that bike lanes should be implemented throughout campus, or at least in major parts of heavy traffic, to allow bikers safe passage from cars on the roads and pedestrians on the sidewalks. In addition, surveyors and interviewees did not have a preference for having the bike lanes built on the road or on/next to the sidewalks, as long as it can be paid for. One final insight gathered from the results is that there should be a decrease in car spaces. By having less car spaces only to be reserved for faculty members and commuters, this will discourage having cars on campus, thereby lessening traffic conflicts with pedestrians and other modes of transportation on campus.
User Needs
According to some experiences of students/professors, we have found that there are problems to be solved for a safer campus environment and all modes of transportation on campus. We perceived that most participants preferred bike lanes to help provide safety and better flow of traffic. Also, we have discovered that most students use the application of the shuttle bus on campus. From this, we identified that there needs to be a better detailed version or explanation of features of the bus application to understand bus routes and schedules. This could include creating an user instruction manual guide detailing how to use the bus schedule app and its features or a simpler bus map app that maps all bus routes colored and time of arrival all at once or filtered.
Pain Points
As traffic can be atrocious around certain parts on campus and during certain times of the day, it can be difficult to get to class or other destinations on time. For bikers, they may need to cut through large groups of people, all the while driving quickly, and it can be dangerous if they cannot stop in time, causing them to crash onto incoming traffic or pedestrians if inexperienced. For car drivers, there can be an unending flow of pedestrians and buses blocking their paths on a one-way road, causing them to be stuck in place for long periods of time. Although there does not seem to be many incidents reported, an improved system of managing pedestrian, biker, and car flow is needed to lessen traffic congestion and overall experience of moving around campus better.
Gaps
Although some of our responses from our surveyors and interviewees were replied in great detail, these voiced opinions may not be representative of the entire student and faculty body on UMD campus. Also, some responses were lacking or did not fulfill the requirement of the question asked so we will need to reformat some questions and add more detailed ones. Overall, more interviews should be conducted, including more professors, board members, and experts like DOTS staff. By having more of a variety in responses, we can visualize a more accurate understanding of how transportation affects students and faculty life as it is a major part of traversing through campus.


V.
PROTOTYPE TESTING
Brainstorming and Prototype Development
Through our process of open coding to gather the main points of each interview, and clustering (Axial coding) to group our findings, we have learned much from our data on user needs, suggestions for improvements, and what further research we need to conduct. In one of the interviews with a student, we have discovered that the student is late to her class most of the time due to the car/pedestrian traffic passing from the Math Building (William E. Kirwan Hall) to get to her class in the ESJ building. This also happened to the other interviewees (students) we had. From these stories of unease with getting to class on time, we’ve noted several high traffic areas and planned to frame a design that will be convenient to most people. With this in mind, we proceeded with the 10 + 10 process. In our first part of the 10 + 10, we came up with a variety of ideas that might help solve the problems that we learned from our interviewees. Some ideas include adding bike lanes, hoverboards, car sharing, cable cars, a trolley system, and many more. Our second part of the 10 + 10 includes creating 10 varieties of one chosen idea. We chose bike lanes as our idea to vary and some of the ideas are bike lanes on roads, bike lanes next to sidewalks, car tunnels, pedestrian bridges, and more. For the ‘We Believe’ process, we made four assumptions on what we believe our users should achieve, and how we’ll know we’re right through feedback, reports, and measurements. Overall, we ultimately went with the idea of a pedestrian bridge because it was an innovative and interesting idea.
Research Question
"To understand the behaviors and decisions of our audience who use the UMD campus when presented with multiple scenarios and conditions."
Research Methods
Process
We, as a group, individually presented those we interviewed in the past with the task of responding to a series of scenarios and providing feedback for our designs. Using powerpoint, we provided 16 scenarios with images as aid and asked how our participant would respond to the given situation. Would they use our idea of a pedestrian bridge, continue to cross the road as normal, or use any other method of crossing the street? Each scenario had conditions based on the weather, traffic density, and whether or not the participant is starting from inside or outside of the building they are crossing from. Based on the participants response, we gave a score of +1 point that would eventually be tallied at the end. The score of each decision, we can determine which method of crossing the street was the most popular and therefore most likely to be used.
Number of Participants: 8 people tested our prototypes
Each team member was tasked with conducting the test process with at least one participant they have previously interviewed. The results of each testing session were then combined into one document where the scores are translated into quantitative data from using Tableau, Weka, Open Refine, decision trees, and information gain calculations.


Analyses and Findings
Analyses
From loading our combined scoring .csv file into Weka, we can see that the attribute of Path to Take shows 88 counts of ‘Yes’, which means that users crossed the bridge to get to the other side of the road, and 40 counts of ‘No’, which means that users just crossed the road to get to the other side. (Figure 1)
We used Naive Bayes, a machine learning method, to run this dataset and calculate the probability of a class, which in this case the path to take (bridge), is predicted to occur, assuming that the attributes are independent of each other. The % of correctly classified instances is 87.5%. This is a good model. 87.5% of instances were correctly put in the right class, which is decently good. In the confusion matrix, this is okay because there are more correctly identified ‘a’ in class ‘a’ and ‘b’ in class ‘b’ than a wrong class identified in another class. The confusion matrix is quite balanced and predicts accurately about 90% of the time for no and 70% of the time for yes, which is good. True Positive Rate is fair, and False Positive Rate is low as class instances are mostly correctly classified. The area under the curve ROC Area, generally higher the better, and 0.904 is good. Also, the Kappa statistic is showing .6967 of the expected accuracy and the actual accuracy in the validation sets, which is above average. Finally, the Relative Absolute Error (RAE) is only 55.13% which isn’t the best as it is not close to 0, but at least much better than random guessing (which would be 100%) so it’s again fair. (Figure 2 + Figure 3)
We used OpenRefine for data wrangling, cleanup, and transformation on my dataset and grouped the values based on the path to take and the total case of scenarios. This allowed for an easier and cleaner way of viewing the data and how much of the values is filtered and displayed in each feature through grouping. (Figures 4 - 6)
Using Tableau allowed us to group the data into an organized table of the four attributes and display a visualization showing the path to take with red for bridge and blue for crossing the road. From this bar chart, we can see an overwhelming response for taking the bridge to cross the road when the participant started inside and a split in choosing the bridge or road depending on the traffic and weather when started outside. (Figure 7 + Figure 8)
In conclusion, from doing manual calculation of the information gain on the attributes traffic, location, and weather, we learned that since the number of bits for gain in location is greater than the gain in traffic and weather, the better gain is in Location (0.233 bits). In other words, location is more likely to influence users in their choice of taking a path. (Figure 9)
Findings
What we learned?
Most of our participants were in favor of our plan for having a bridge built as a way of crossing the road (ex. between two buildings like between Hornbake and ESJ building).
According to our participants, the 16 scenarios mentioned during testing were helpful in knowing how and when the bridge would be used, depending on the change of weather, location, and traffic.
Of the three factors in influencing the path to take, location was surprisingly the most influential in determining how participants crossed the road.
One major reason why participants decided to use the bridge was due to convenience. Where they had started (inside or outside) the building and shelter from the weather were two conveniences our participants mentioned most.
When the scenario had rainy weather, all but one of the 32 responses chose to use the bridge regardless of location and traffic condition.
More participants chose to cross the road when starting from the outside on a sunny or cloudy day than compared to when the weather was rainy or snowy.
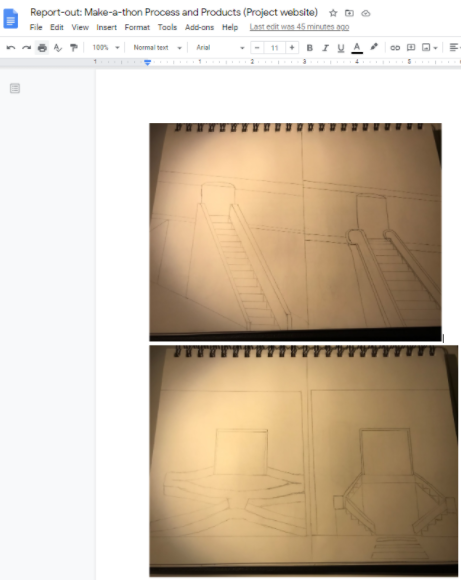
The participants provided more suggestions that could help improve our bridge design upon looking at our example drawings and images. The suggestions include:
Stairs over escalators as escalators require frequent maintenance and are large
Stairs that are u-shaped (half-turn) compared to straight as the u-shaped save more space and are more compact.
An overhang or ceiling over the bridge and stairs is preferred over having none because it can provide further shelter from the weather and shade.
Having an access ramp as replacement for stairs is more friendly for all who use, especially the disabled. A downside would be that it would take longer and more effort to go up or down the ramp as the distance travelled is longer compared to standard stairs length of distance from bridge to sidewalk.


VI.
CONCLUSION
From our initial round of interviews with students and faculty, we discovered that common problems with the current state of transportation on campus are caused by the current infrastructure. With the different available modes of transportation, such as walking, biking, and driving, the majority of complaints were on how they interfered with one another. Pedestrians interrupt cars, cars interrupt bikes, and so on. Some suggested solutions or improvements were to keep the transportation methods independent from one another, like installing bike lanes, traffic lights, and pedestrian bridges/tunnels. Our second round of interviews with students determined that location was the determining factor in how the participants decided to cross the road, mainly due to convenience of when they would be starting from inside the building or for shelter from the weather.
A major feasibility concern for our idea is the overall financial cost. We plan to interview more faculty members and experts in the future to possibly optimize our solution. With findings of a more varied and balanced response list, we hope that transportation on campus will become more diverse, inclusive, and equitable for everyone, all while promoting safety, efficiency, and lessening traffic to increase the overall travelling experience on campus.
Some changes we would like to make to our design are simply based on interactivity. We want to create a more interactive prototype for more interactive testing. As a result of being in a pandemic, we were unable to create a hands-on physical prototype for our participants to interact with and better understand our project. This type of activity would require doing in-person testing, so we want to be able to create and show a physical model to participants in the future. If we cannot achieve in-person meetings with participants, a possible alternative may involve creating an interactive 3D model. A 3D model will allow users to simulate being in a virtual environment and have them pick a path to choose while also being able to control the different attributes of different scenarios. This way, all participants can ‘live’ through the experience in each scenario and make more ‘accurate’ choices without the need of in-person interaction.
The recommended next steps for our project involve more testing for a broader and increased number of responses. We only had eight participants, who are around the same age, to test our prototype. It would be interesting to see what responses we would get from younger, older, and disabled participants. Another possible next step could be in-person testing. This will allow us to show and have our participants interact with our models instead of having them rely solely on pictures. The final and most important step for our project would be to pick a finalized bridge design and start to build a prototype for that design based on the suggestions from our participants. This final prototype could possibly be used for an actual pitch to the university’s transportation department and board of UMD.